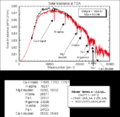
Spectrum of solar irradiance at top of Earth's atmosphere.
- Neither Sun nor Earth are black bodies; both have significant absorption by certain gases in their atmospheres, which produce absorption lines in their electromagnetic spectra, which is the distribution of energy as a function of wavelength, or wavenumber.
- Wavenumber is the number of waves per unit length, the inverse of wavelength, and is usually given in inverse centimeters, or cm-1, with 5,000 cm-1 corresponding to a wavelength of 2 millionths of a meter, or 2 microns. Taking inverses, 10000 cm-1 is 1 micron, 20000 cm-1 is 0.5 microns, and so on to larger wavenumbers, and similarly 2000 cm-1 is 5 microns, 1000 cm-1 is 10 microns, and so on to smaller wavenumbers.
- The distribution of energy versus wavenumber is the spectrum.
The best current estimate of the spectrum of solar irradiance at the top of the atmosphere is based on line-by-line computations by Bob Kurucz of Harvard Smithsonian Observatory. Units are watts per square meter per inverse centimeters per steradian, and the original data has been degraded to 20 cm-1 resolution.
The red line gives the best post-1992 solar spectum estimate, and the dark line shows the best previous estimate of the spectrum. Note the marked improvement provided by the more recent higher spectral resolution line-by-line computations. (Note that if plotted directly in wavelength, the peak would be at 0.5 microns, but a change of variables to wavenumber shifts the peak to 10000 cm-1 = 1 micron.) Common absorption lines are identified, including doubly-ionized calcium and the first four lines of the hydrogen Balmer series.
Source
| Public domainPublic domainfalsefalse
|
Source: http://climate.gsfc.nasa.gov/~cahalan/Radiation/SolarIrr.html
Author: Robert Cahalan
(Moved from en:Image:Solar_irradiance_spectrum_1992.gif)


