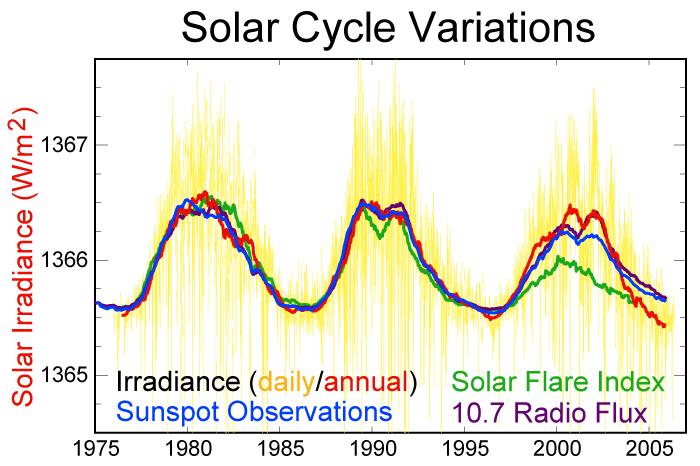
File:Solar-cycle-data.png
外观
Solar-cycle-data.png (700 × 466像素,文件大小:37 KB,MIME类型:image/png)
文件历史
点击某个日期/时间查看对应时刻的文件。
| 日期/时间 | 缩略图 | 大小 | 用户 | 备注 | |
|---|---|---|---|---|---|
| 当前 | 2008年2月1日 (五) 08:31 |  | 700 × 466(37 KB) | Xiong Chiamiov | optimized using optipng |
| 2006年7月20日 (四) 20:12 |  | 700 × 466(44 KB) | Nils Simon | == Description == thumb|right|350px|Variations in sunspot number since 1610. thumb|right|250px|Changes in solar activity since 1400. This picture depicts the last three solar cycles | |
| 2005年5月24日 (二) 12:55 |  | 753 × 565(9 KB) | Xenoforme~commonswiki | Pic of 20 years of solar output data. Created by William M. Connolley using IDL. Data source: http://www.pmodwrc.ch/dat/composite_d19.asc which is linked from http://www.grida.no/climate/ipcc_ta |
文件用途
全域文件用途
以下其他wiki使用此文件:
- ar.wikipedia.org上的用途
- ast.wikipedia.org上的用途
- be.wikipedia.org上的用途
- bg.wikipedia.org上的用途
- cbk-zam.wikipedia.org上的用途
- cs.wikipedia.org上的用途
- da.wikipedia.org上的用途
- de.wikipedia.org上的用途
- en.wikipedia.org上的用途
- Sun
- Solar maximum
- Solar cycle
- Solar minimum
- User:Dragons flight/Images
- Gnevyshev–Ohl rule
- List of solar cycles
- Talk:Climate change/Archive 22
- User:UBeR/GWcleanup
- Talk:Climate change/Archive 23
- User:Mporter/Climate data
- Solar cycle 24
- Global Energy and Water Exchanges
- User:Mytwocents/Globalnull Warmingnull
- Solar cycle 2
- Solar cycle 1
- Solar cycle 3
- Solar cycle 4
- Solar cycle 5
- Solar cycle 6
- Solar cycle 7
- Solar cycle 8
- Solar cycle 9
- Solar cycle 10
- Solar cycle 11
- Solar cycle 12
- Solar cycle 13
- Solar cycle 14
- Solar cycle 15
- Solar cycle 16
- Solar cycle 17
- Solar cycle 18
- Solar cycle 19
- Solar cycle 20
- Solar cycle 21
查看此文件的更多全域用途。


